Beta Performance Management and Training Load Charts
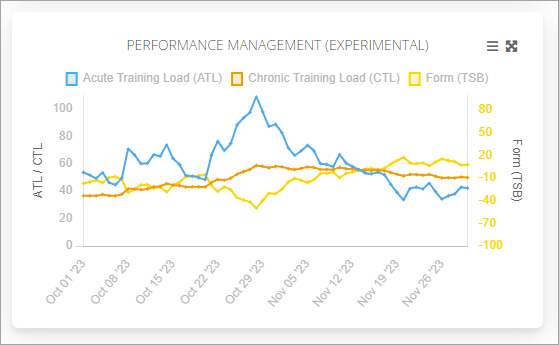
Our new Performance Management and Training Load charts are now live. The PMC chart shows calculated form, fatigue and fitness over time. The chart currently only shows historic data but future releases will show estimated data into the future to help with planning.
You can access it from the athlete data dashboard here.


Performance Management Chart
This chart show Form (TSB), Fitness (CTL) and Fatigue (ATL) calculated over a given data range. For this to be accurate it's important that all athletes have the Threshold Power, Pace and Heart Rate set in their Training Zones as those values are used to calculate Effort/Stress for individual workouts that are then used to calculate the metrics in the chart. The system will also fall back to actual perceived exertion from the athletes feedback if no other threshold values are set.

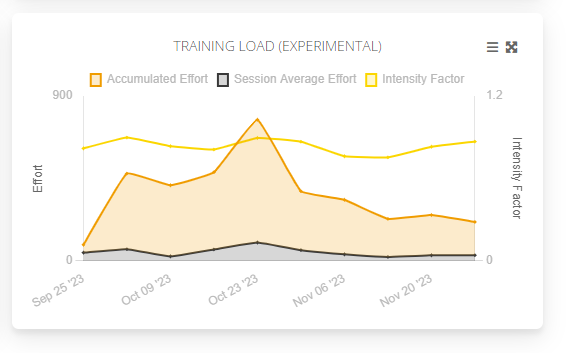
Training Load Chart
This chart shows accumulated effort/stress, average stress per activity and also average intensity factor.

You can open the charts into full screen mode using the expand icon.

Future development includes;
- Plotting individual workouts on the PMC chart to be able to drill down to specific data
- Plotting estimated stress/load into the future based on estimates from plannee\d workouts