Performance Insights Enhancements
We've just released some improvements to the new Performance Insights page with 3 new charts and the ability to filter by activity type. We've also added a few more metrics to the new individual activity screen.
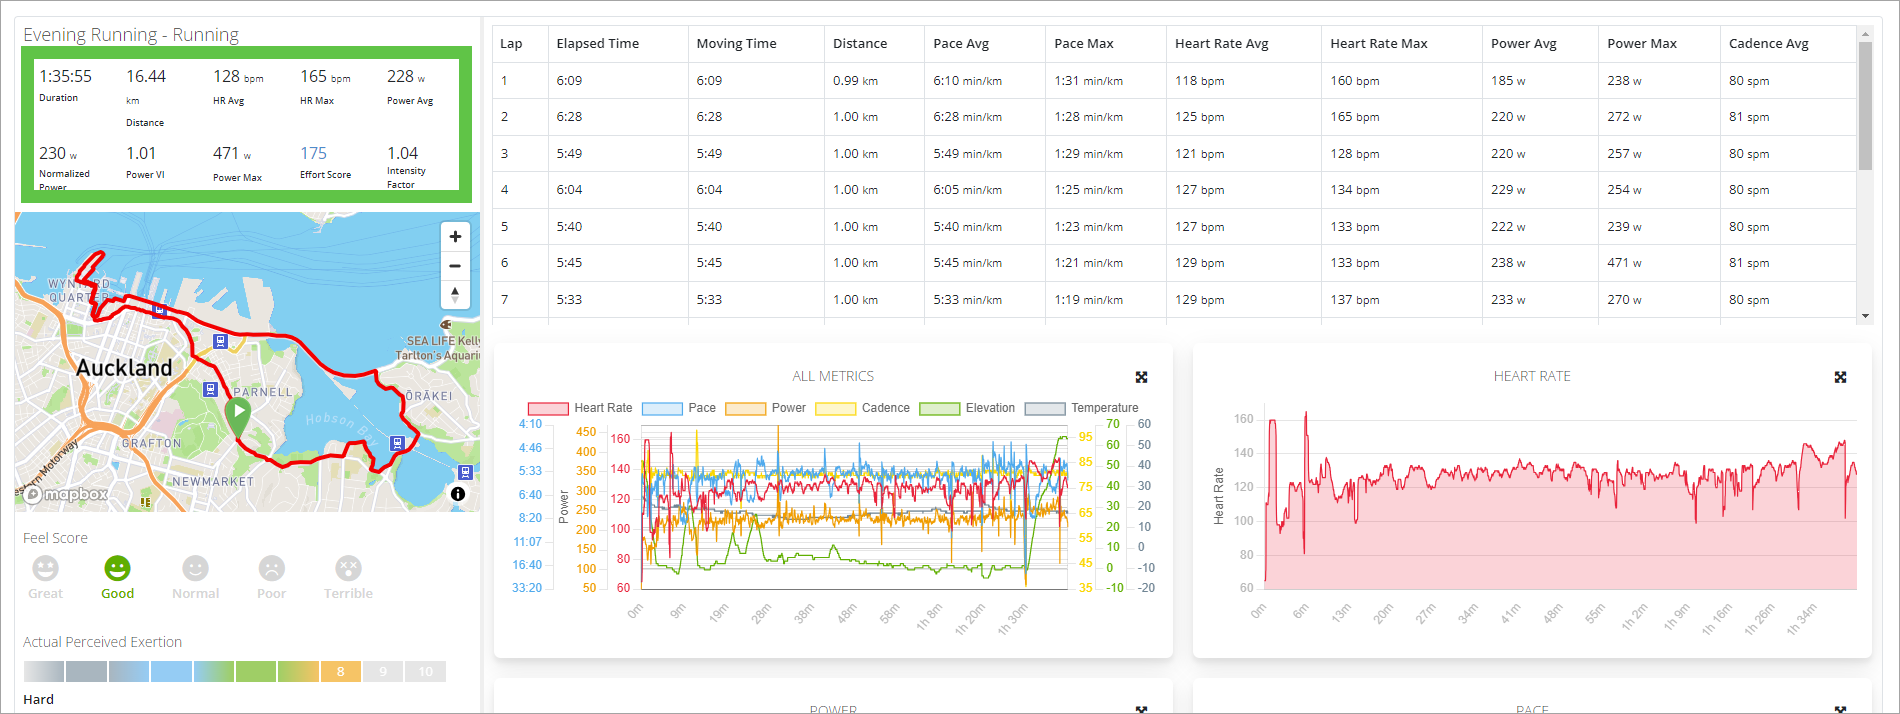
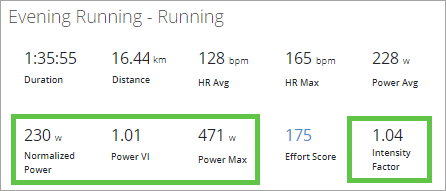
New Individual Activity Metrics
We've added a few new metrics to this view, including VI (Variability Index) for power. You can get to these new screens from the activity search, or by clicking on the three bars on the calendar of a completed workout.
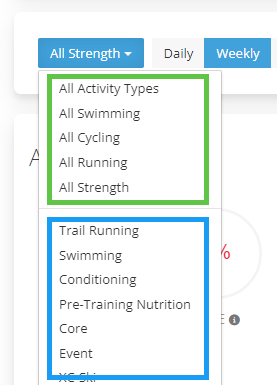
Activity Type Filtering
You can now filter the charts by activity type. The first set of types will filter by grouping all running, all cycling etc. Where the second section will filter by the exact activity type.
New Charts
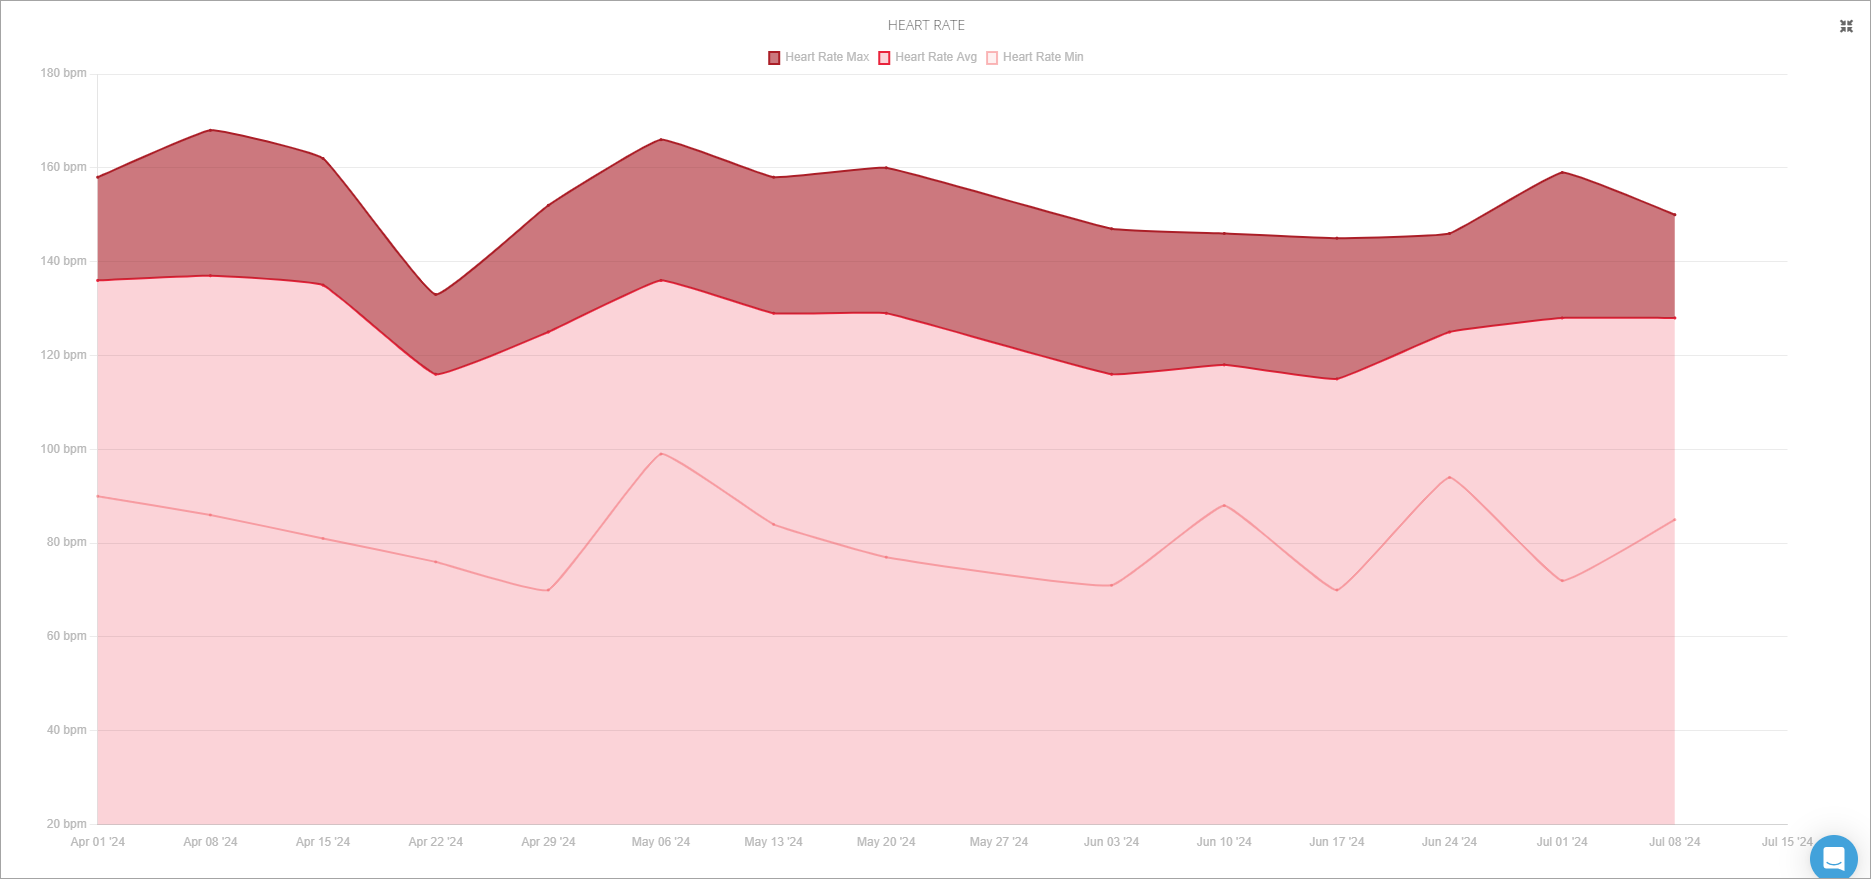
Heart Rate
The new Heart Rate chart plots, maximum, average and minimum heart rate trends over time.
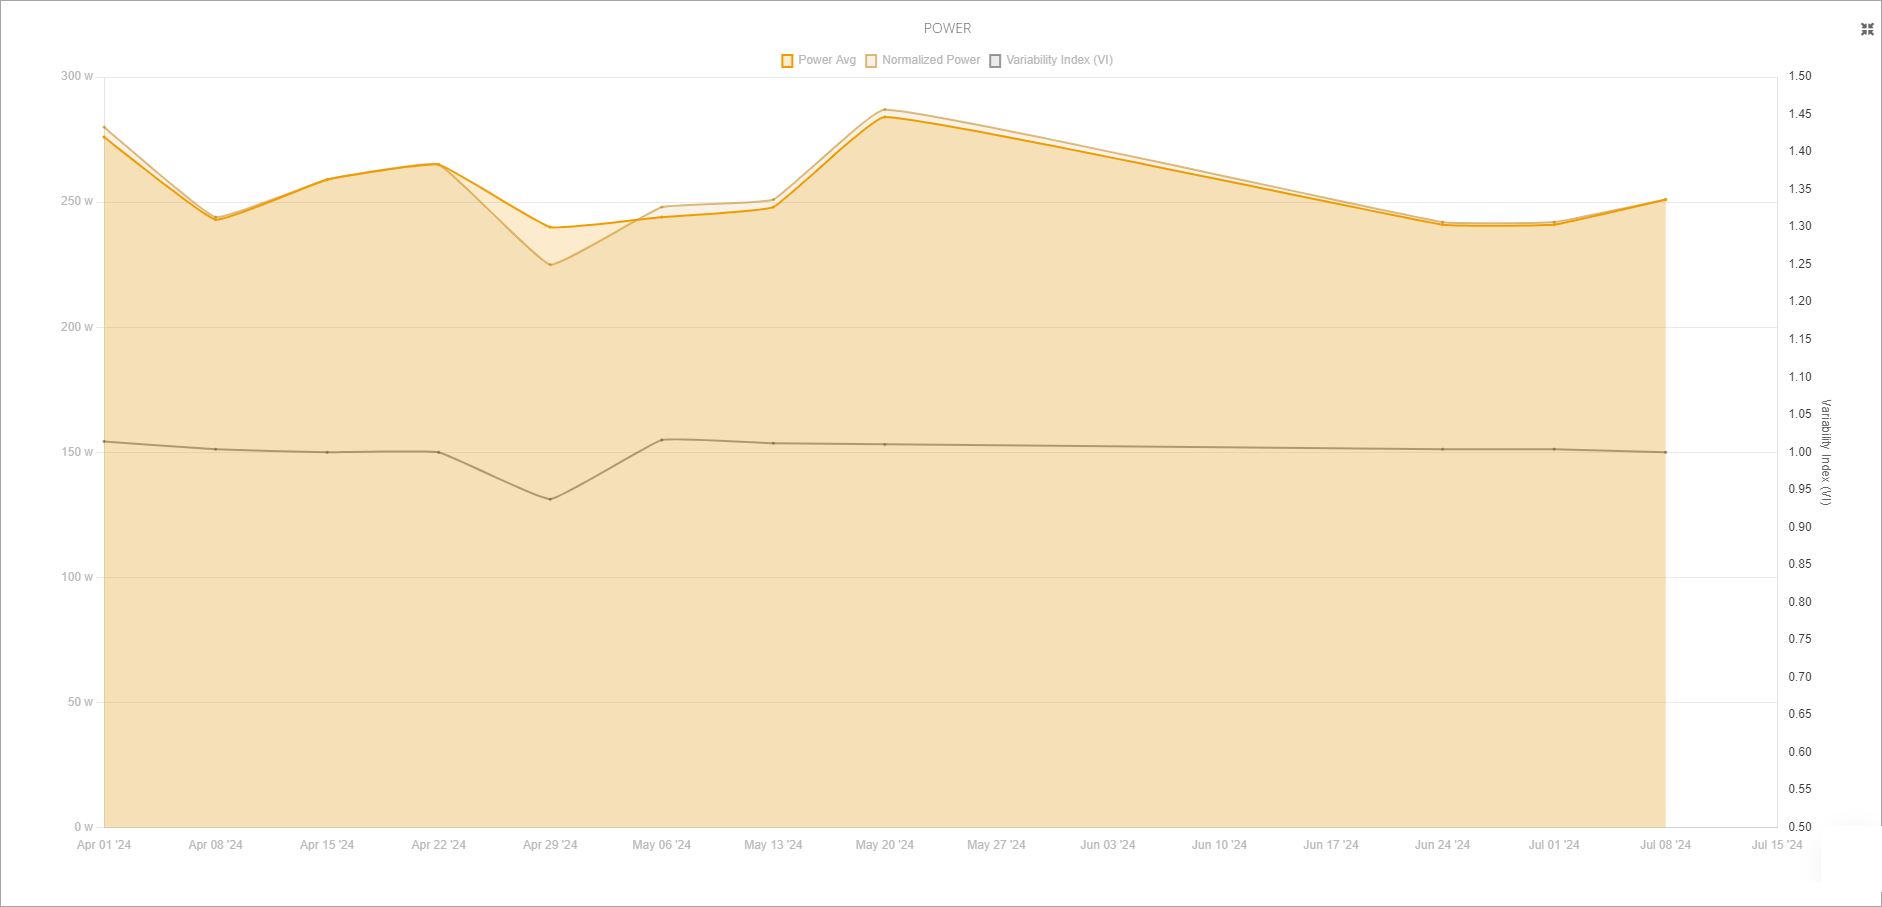
Power
The new Power chart plots average power, normalized power and the power variability index (VI) over time.
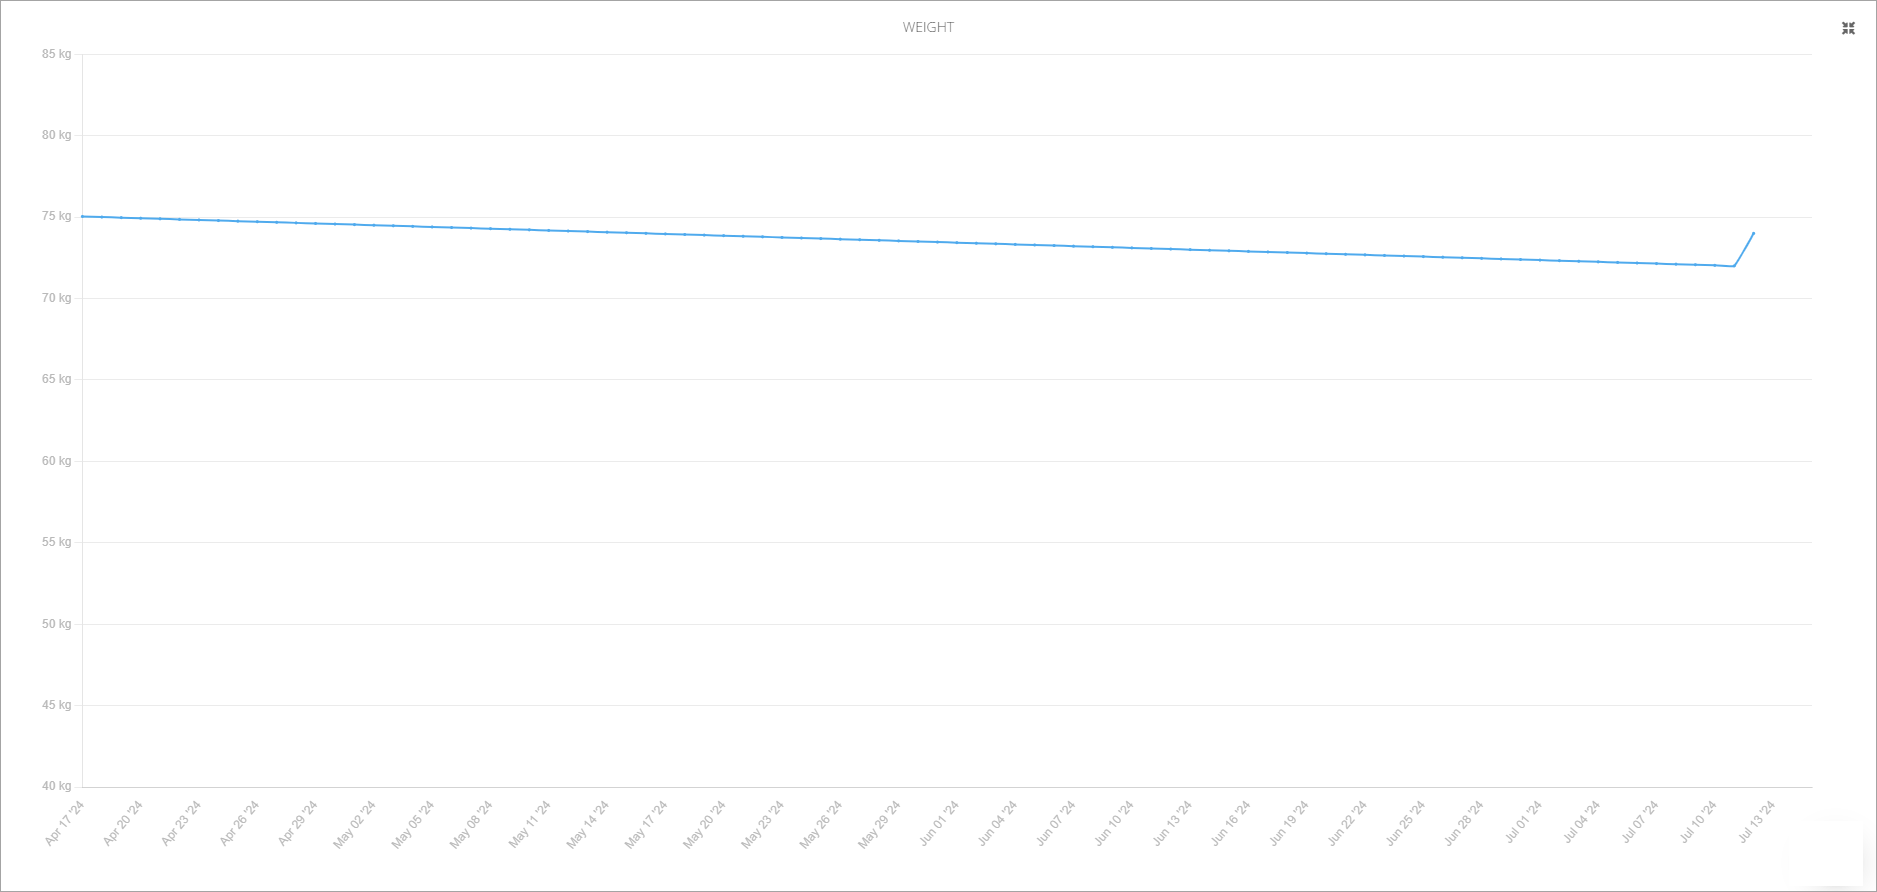
Weight
If you and your clients are tracking their weight over time, this chart will also display to show.
What's Next?
We have a few more charts in the works but before we add them, we will be adding a new feature to the insights page so coaches and clients can configure which charts they see and which they don't.